
How we built a platform to display the globe’s COVID-19 data in three months
Flatfile is a Denver-based startup that helps product teams save time by providing out-of-the-box data importing tools that are easy to implement and use. With Flatfile, app developers no longer need to build tools from scratch for their end-users to upload spreadsheets. Flatfile approached Begin to develop the first release of CSV.org, a new, complementary software platform.
Tech Used
React, Next.js, NestJS, PostgresQL
We Lead With UI/UX
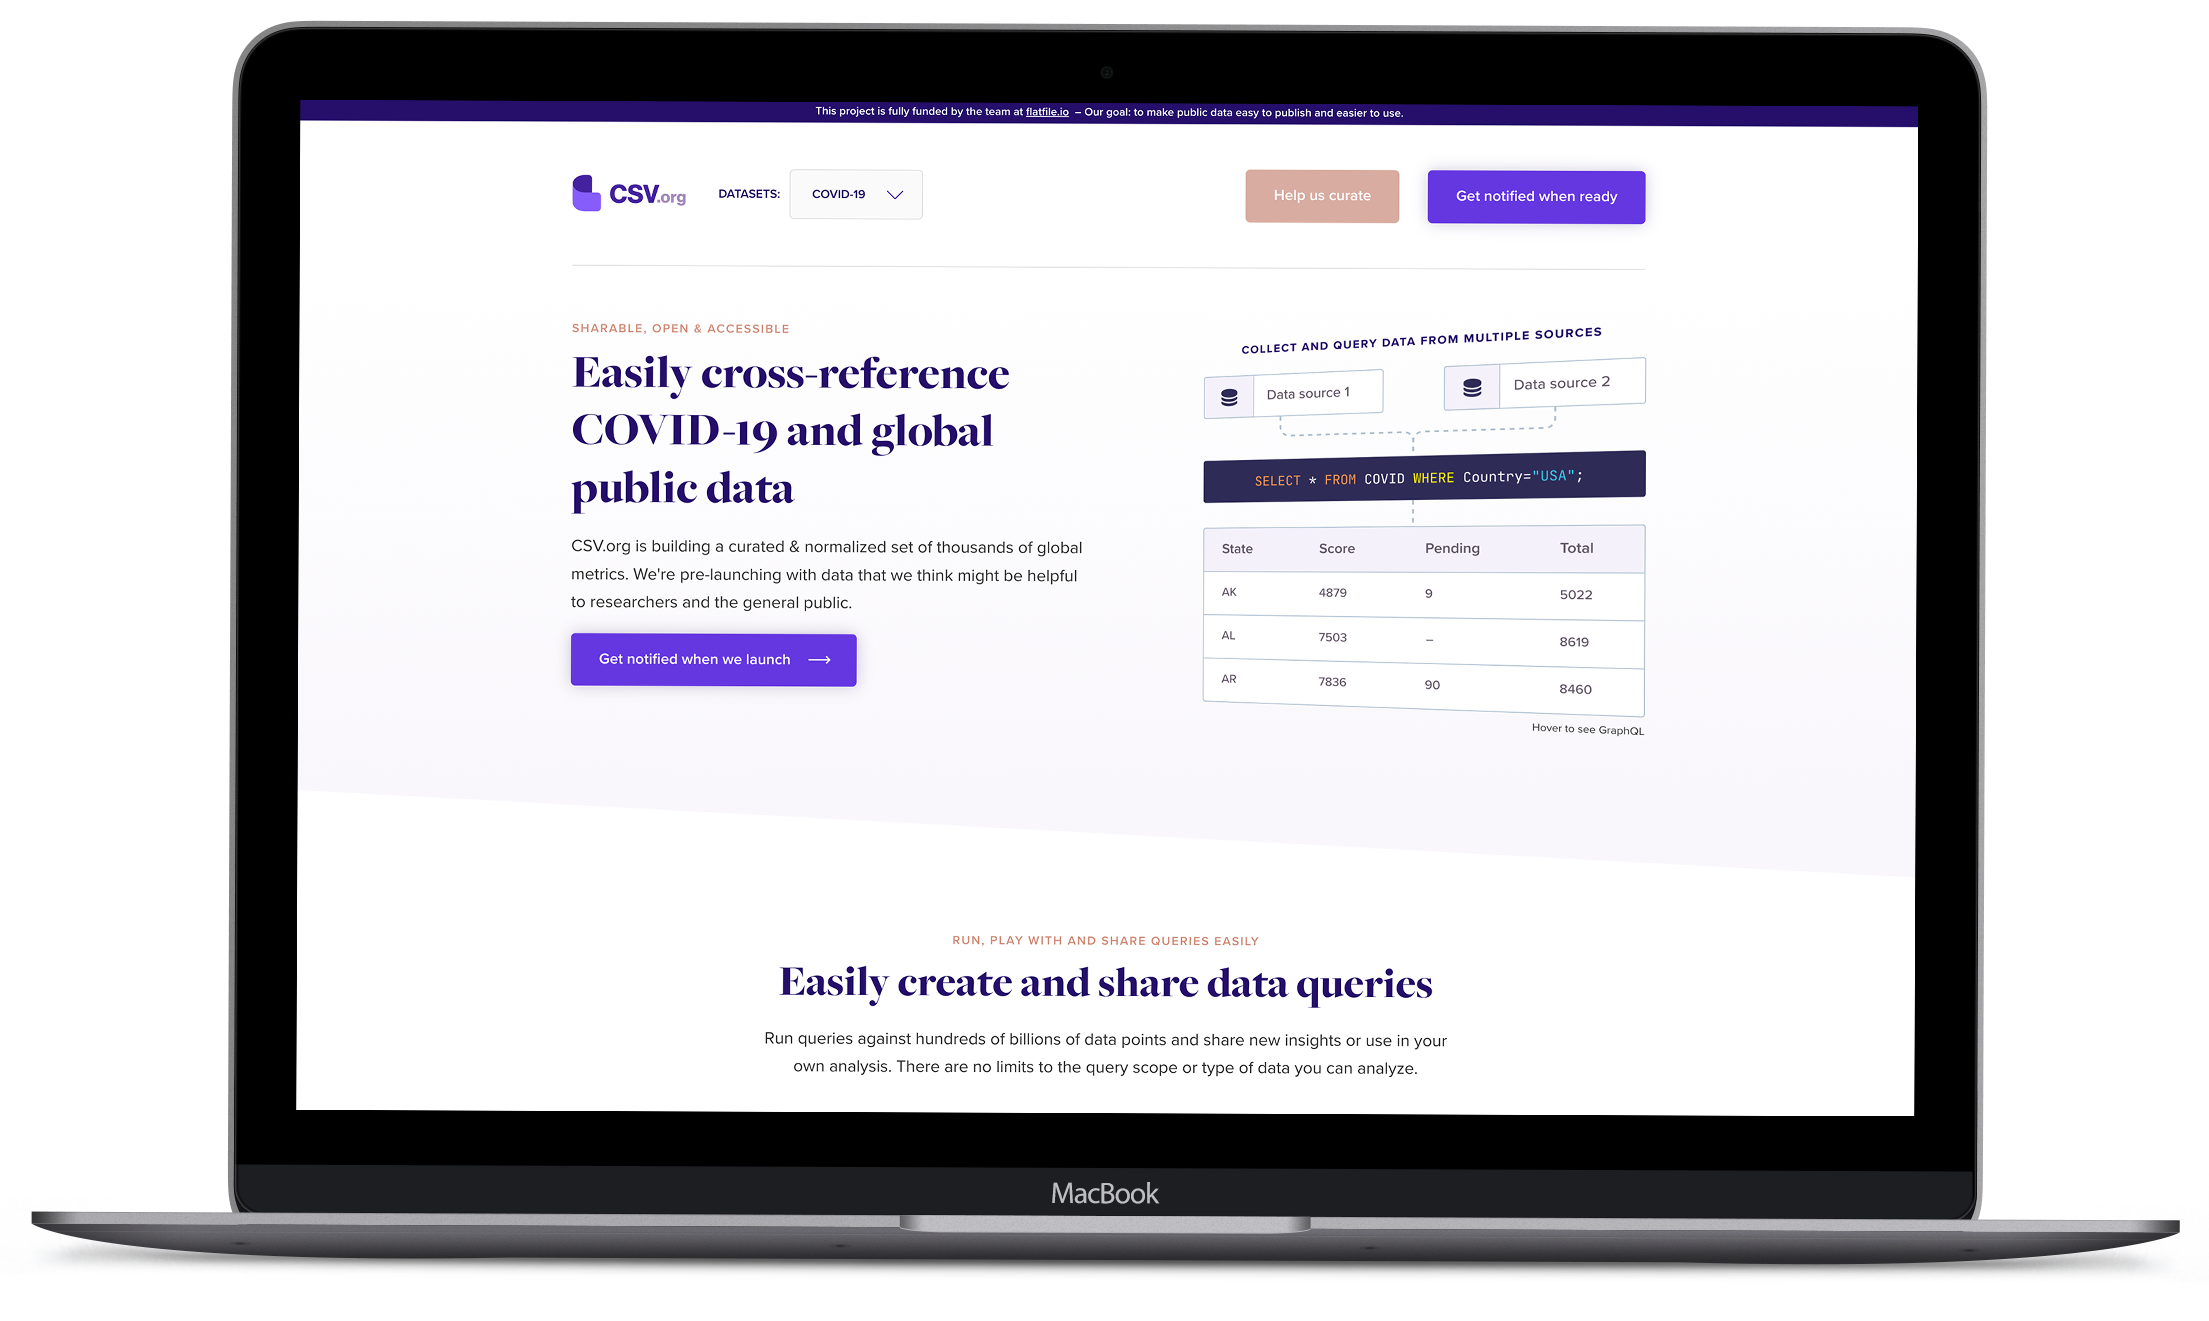
Easily Create & Share Data Queries
The Idea
They had an idea to create a complementary platform to source, make accessible, and visualize the world’s publicly published data. For example, federal, state, county, and city governments publicly publish data about their constituents every week. Unfortunately, that data is not standardized and it’s difficult to find, use, and make meaning of.
With the COVID-19 pandemic emerging during the initial planning, Flatfile had an idea to utilize domestic and global Coronavirus data as the initial dataset for the first release of CSV.org. As the platform matured, we would source more and more data (climate, employment, etc.)
"Taking an unfathomable amount of data and making it accessible to everyone is a daunting task, but it was made possible with our React app anyone can use"
Our Process
There were two key challenges that became immediately apparent: 1) finding trustworthy and dependable data sources for each geopolitical territory, US state, and US county. 2) design a simple and elegant interface for technical and non-technical users to get value from.
We worked closely with Flatfile’s team through a highly iterative design process. As mockups were completed and approved, they were handed to our engineers for development, then to QA & Review, etc. and the cycle repeated.
Technical Implementation for Devs
We created a recursive data structure that allowed datasets to contain, reference, or expand other datasets. The datasets are updated automatically, based on each set’s frequency, by fetching from their own individual sources. Data that isn’t available is extrapolated from other data points. For example, the United States country COVID-19 data was a sum of all of the individual states’ data.
From a technical standpoint, the tool was built utilizing Next.js to provide server-side rendering, which was key for SEO and performance. The backend was built utilizing GraphQL on NestJS, enabling dynamic data pulling as needed, paving the way for an external-facing API for researchers to utilize. The public-facing web app was built using React, allowing us to create reusable components as the user parses data recursively.
Where is the project now?
We handed over a high-quality deliverable to the client but due to circumstances outside of our control, CSV.org has not been officially announced and launched. If you’ve read this far you’re most likely thinking “So, why write all of this and publish it on your site?” Good question! Not every product or idea is going to successfully make it to market. It’s our belief that getting to market isn’t the one thing that makes a project worth writing about. We are proud to have the opportunity to develop CSV.org and are fond of the challenge to work in parallel with Flatfile to achieve a common goal. It was a fast and exciting 3 months with tons of learning and that’s why we feel it’s important to share this case study. Thanks for reading.